APKPure Appを使用する
Electricity Mapsの旧いバージョンをダウンロードすることが可能
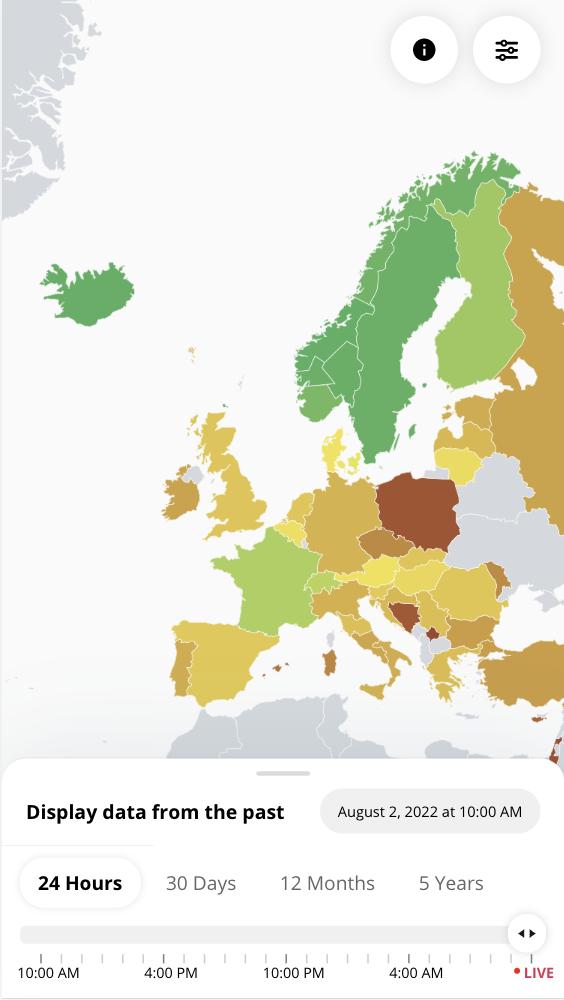
電力消費のライブCO2排出量
Electrical Maps は、電気がどこから来ているか、また電気を生成するためにどれだけの CO2 が排出されたかを示すライブ視覚化ツールです。
このアプリには、世界 200 以上の地域の発電内訳、電力の炭素強度、総排出量、電力取引が表示されます。
Electrical Maps アプリの背後にあるデータの使用に興味がありますか?当社は非営利用途向けに無料の API を提供し、商業用途向けには予測などが含まれるリアルタイム API へのアクセスを販売します。詳細については、当社の Web サイトをご覧ください: https://www.electricitymaps.com/get-our-data
Last updated on 2025年04月21日
- We have increased geographical coverage (including Mexico!)
- Also, there is now a button to download CSVs from our new Datasets page (as we know people love downloading CSVs on their phone, right?)
- You asked for it, and now it’s back! Yearly aggregates can be found by choosing All Years in the new time range selector.
- One settings to rule them all: New consolidated settings popover
- Various bug fixes and clearer text
最終のバージョン
![]() 1.244.0
1.244.0
投稿者
Al Gozadine
Android 要件
Android 5.1+
Available on
![]()
カテゴリー
報告


Discover what you want easier, faster and safer.

Electricity Maps
1.244.0 by Electricity Maps
2025年04月21日